
See every run and every token
Monitoring is organisation-level and always on. Track what your agents cost, what they were asked, and exactly what they did about it, down to the individual tool call.
On the record
Open the box on any answer
Every response has a trace behind it: the model call, the tools it reached for, the time each step took. When something looks wrong, you do not have to guess why.
- Step-level traces
- Tokens and cost per run
- Logs kept for every conversation
Triage agent · run trace
b4517ae02-9d6c1f88034e
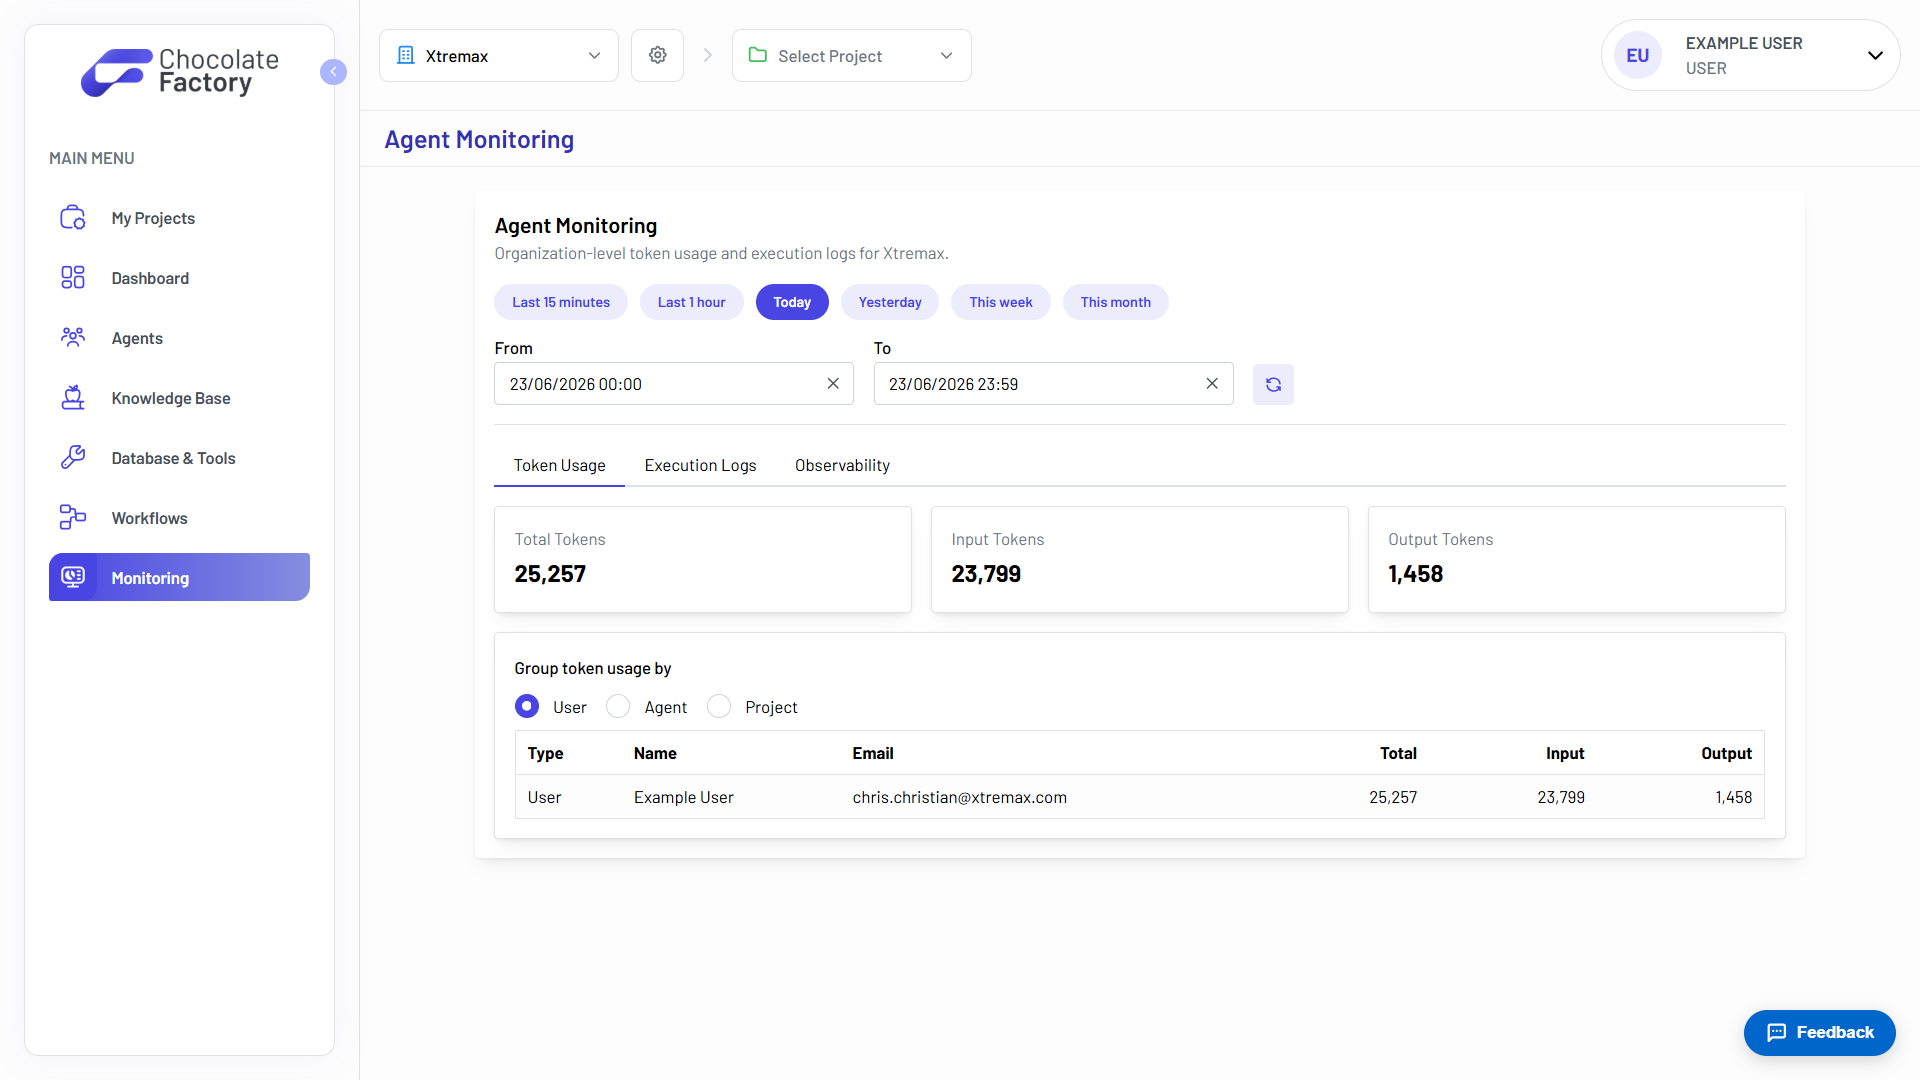
Know what your agents cost
Total, input, and output tokens across any window you choose: the last fifteen minutes, today, this month, or a custom range. Group the breakdown by user, by agent, or by project.
- Input and output tokens, split
- Group by user, agent, or project
- Preset and custom time ranges
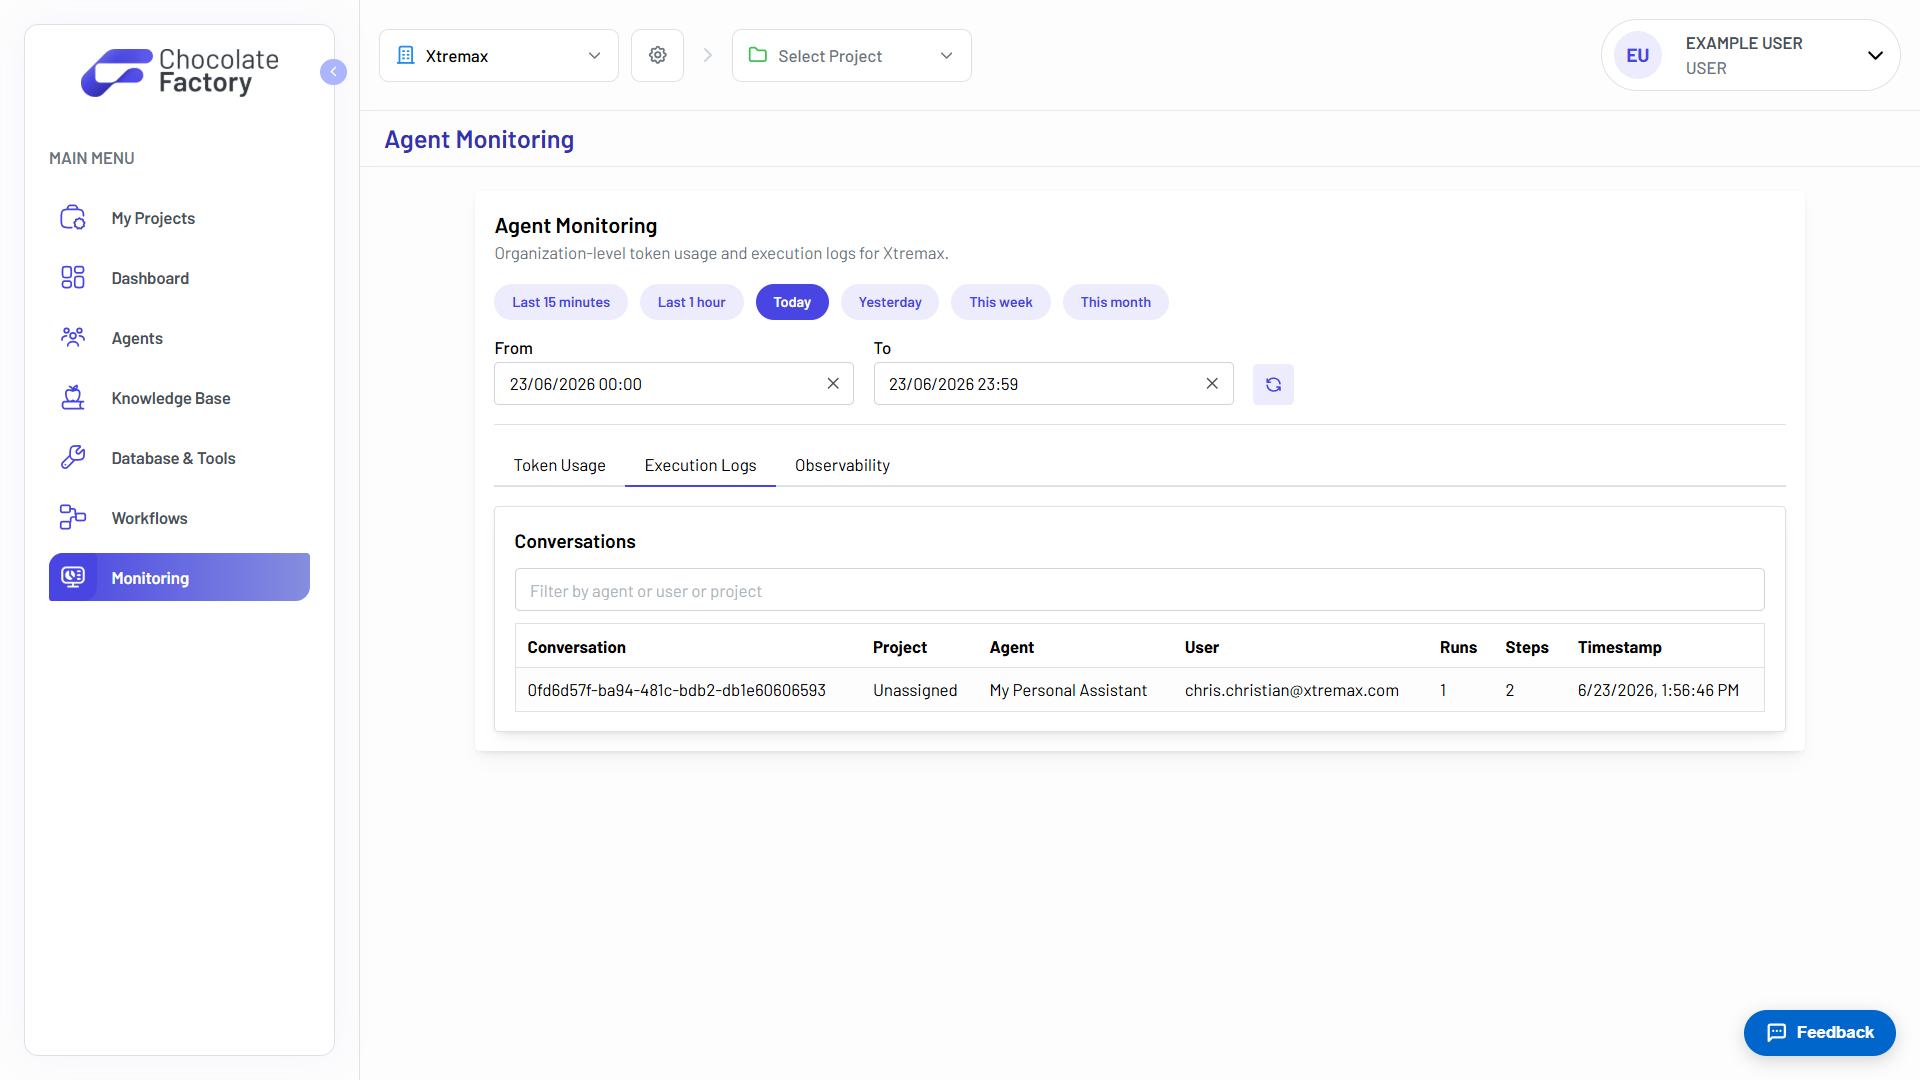
Every conversation, logged
Each conversation is recorded with the agent that handled it, the user who started it, the project it belonged to, and how many runs and steps it took.
- Runs and steps per conversation
- Filter by agent, user, or project
- Timestamped end to end
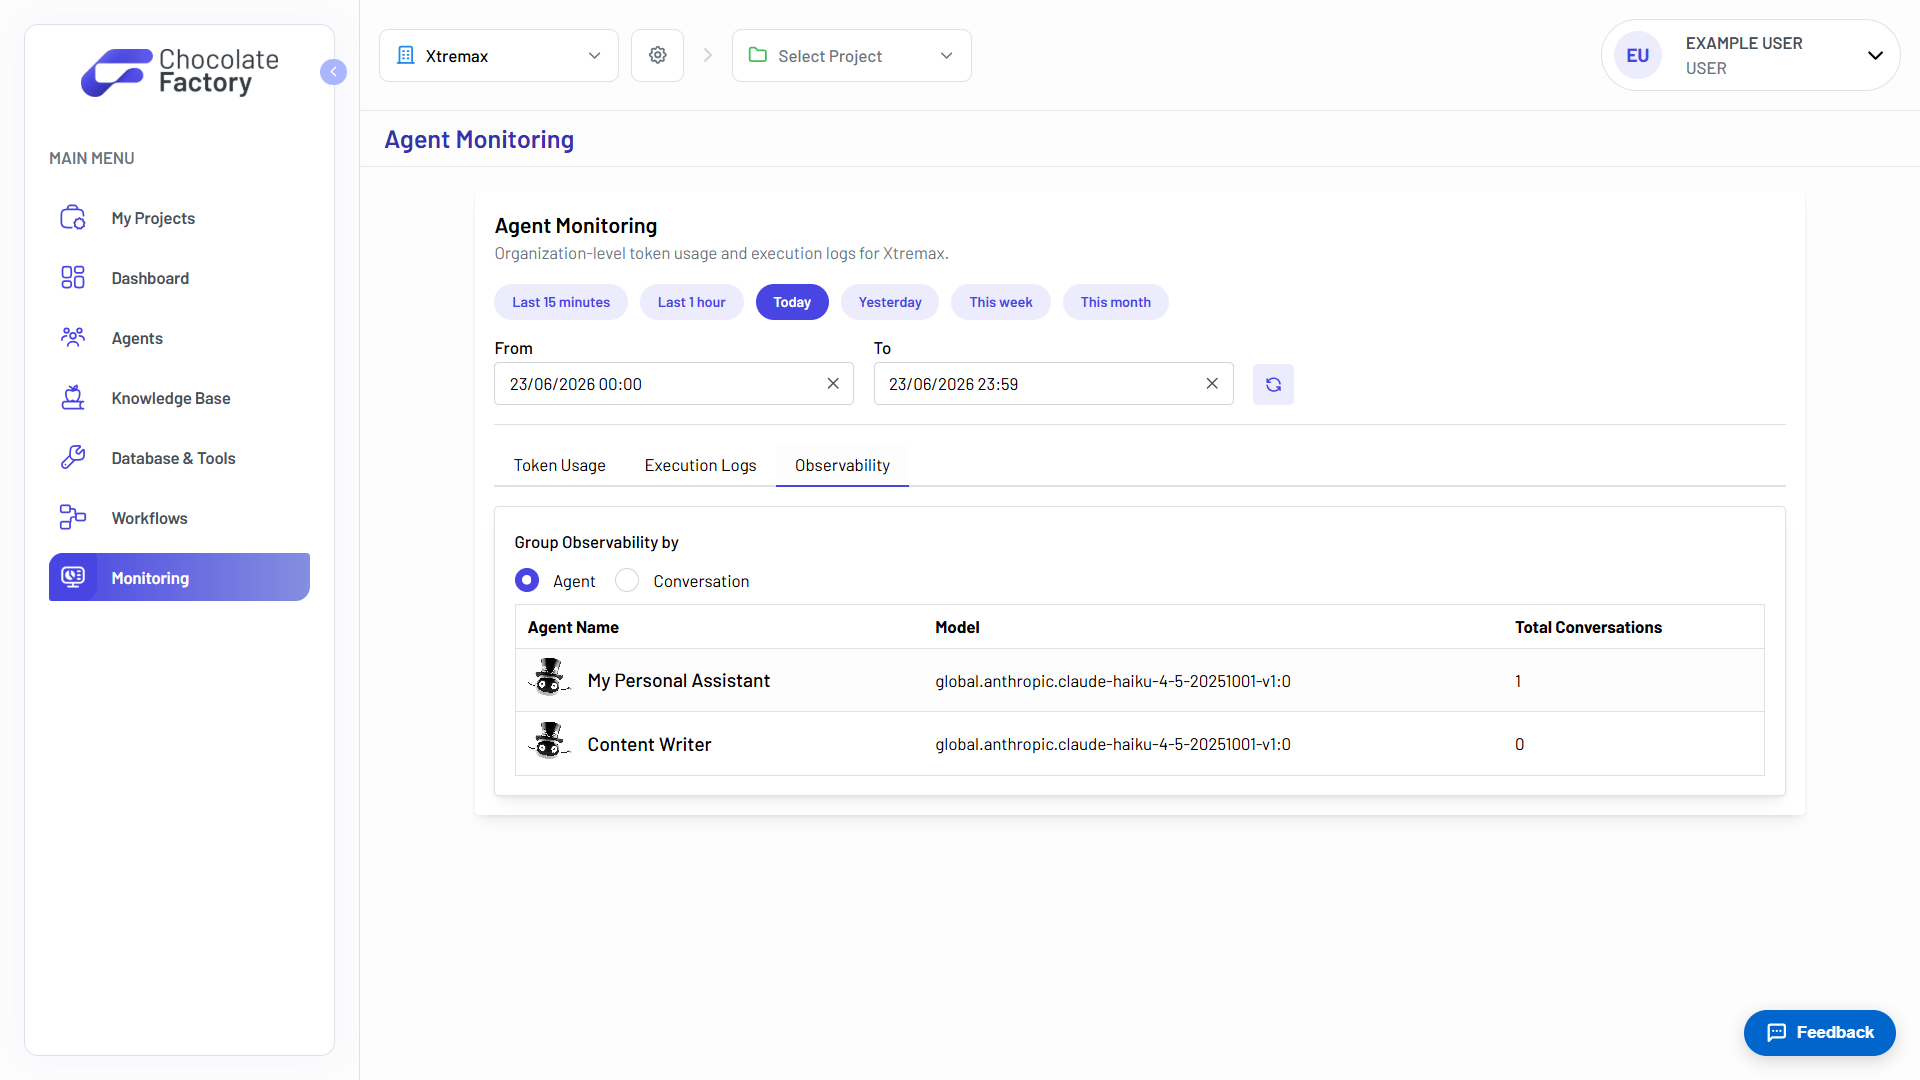
Which agent, on which model
Group observability by agent or by conversation. The model behind each agent is stated explicitly, so you always know what is actually answering your users.
- Group by agent or conversation
- Model named per agent
- Conversation volume per agent
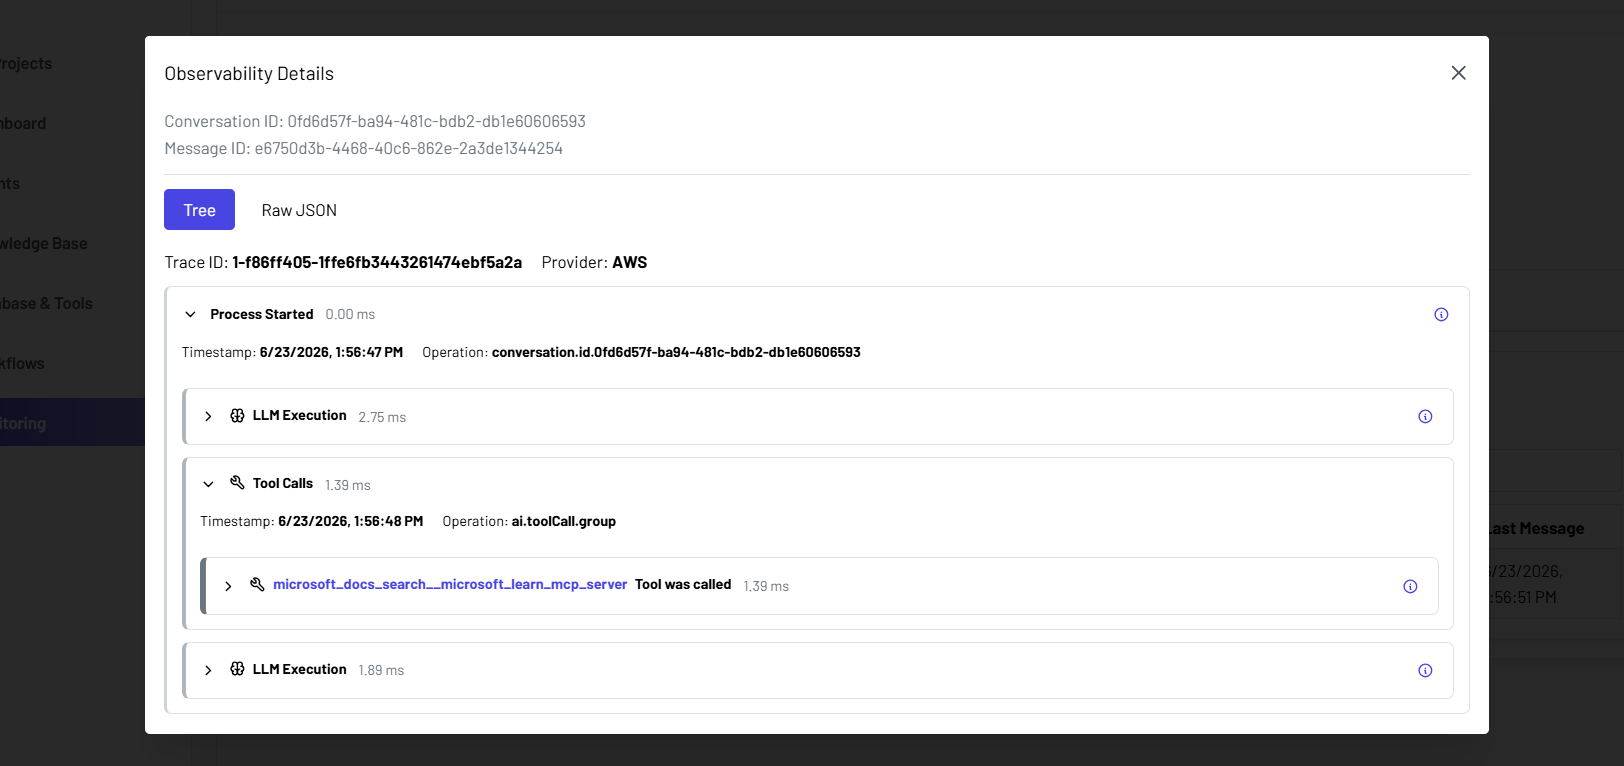
Open the box
Every run expands into a trace: each LLM execution, each tool call, each timestamp, in order. Read it as a tree or drop to raw JSON; the reasoning is inspectable, not asserted.
- LLM executions and tool calls, in order
- Millisecond timings per span
- Tree view or raw JSON
- Trace ID and provider per run
See Observability in action
Spin up your first agent, or walk through Chocolate Factory with our team on a live demo.