In From Cocoa to Chocolate, what separates a dependable system from an impressive demo is whether anyone can see how an answer was produced. Observability is the factory’s inspection window. This piece covers what it shows, who can see it, and the loop of observing, correcting and improving that it makes possible.
The inspection window
A factory that cannot see inside its own line can only guess why a batch went wrong. An agent is the same. Behind every response it works through a chain of steps, and each step is a place where things can go wrong. The final answer can look convincing even when the work behind it was not.
In Chocolate Factory, monitoring is always on and covers the whole organisation. It shows what agents were asked, how much each one handles, and every step they took to answer, including each tool they used and what it returned.
Every conversation, logged
Each conversation is recorded with the agent that answered, the person who started it, its project, and how many runs and steps it took, with a date and time on everything. Conversations can be filtered by agent, by person or by project, and every message can be opened in full detail.
The filters match the questions people actually ask. What has this agent been doing? What did this person see? What is happening in this project? Each one has an answer on the record, not a guess pieced together after the fact.
Request volume, per agent
The business can see how much work each agent is actually handling, which agents are busy, and which are barely used. That is the difference between knowing what the workforce does and assuming it.
The full record behind every run
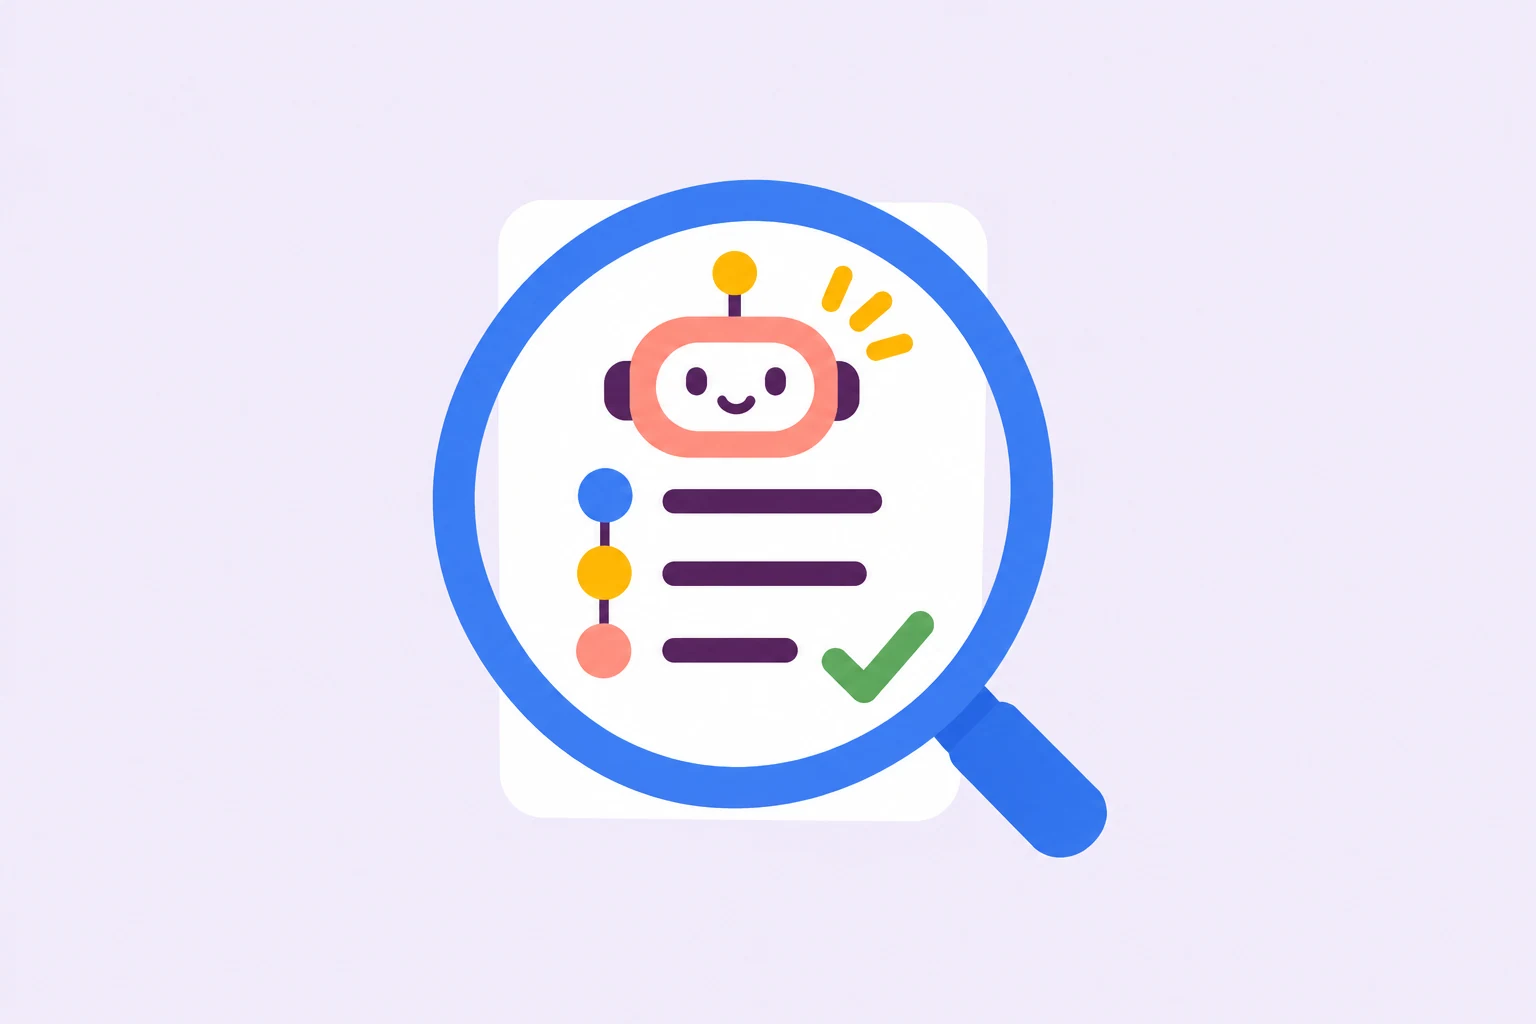
Any run opens into its trace. The trace can be read as a tree or as raw JSON, and it shows how the work became the final output.
What a run’s trace shows
- The reasoning steps behind the response
- Every model call
- Every tool and MCP server called
- What each one returned
- How long each step took
- The run’s tokens and cost
- Its record ID
- The AI provider that served it
Every agent has its own key, so every step in the trace is tied to the agent that took it. Nothing in the record is anonymous.
For owners and admins only
Monitoring covers the organisation selected, and only that organisation’s owners and admins can see it. Usage and conversation logs stay with the people responsible for them. Seeing everything is itself something to control, because the record of what agents were asked holds what people asked them.
A test bench for every agent
The Dashboard chat is where an agent is tried before it meets real users. Send it the questions it will face in production and see each tool it calls, what it sent, and what came back. This is the factory’s testing stage: real questions, tried against an agent, with results compared as things change.
The same chat doubles as an everyday assistant for questions, drafts and files. The interfaces customers and staff use in production are tailored to each enterprise.
Observe, correct, improve
A deployed agent is the start of the work, not the end of it. The businesses that get real returns from AI treat every run as evidence. They watch what the agent did, correct the part that led it astray, and let the fix apply from the next run onward. Then they do it again.
When an answer is wrong, the trace shows the step where it went wrong. The agent may have read the wrong source, called the right tool with the wrong values, skipped a rule, or relied on something out of date.
The team changes only that part, whether it is the instructions, the knowledge, the model, a tool permission or a workflow step, and tries the same question again on the test bench. A process change becomes a new workflow version that runs only when the team says so. Nothing has to be rebuilt.
Agents are tuned with evidence instead of guesswork, because the step where an answer went wrong is on the record.
The loop at the edges
The loop also runs on its own, at the edges. Step and tool-loop limits end an agent that would otherwise go round in circles. Circuit breakers cut off a connector when usage looks wrong or reaches for sensitive data. Budgets and rate limits on projects, keys and paid connectors keep one mistake from becoming a large bill. Problems are contained first and diagnosed second.
It is closer to teaching than to programming, and it is how a head chocolatier runs a line: read the batch record, find the step that drifted, adjust the recipe card, and run the next batch. Because every agent runs on the same platform, each lesson learned in one place is available to every team.
On the roadmap
On the roadmap
- Root-cause analysis for bad answersRoadmapPinpointing why an answer went wrong: the retrieval that fed it, the choice of model, the language, or the wrong tool or data source.
What it changes
Risk, security and compliance get control they can point to: every run has a full trace, and monitoring is limited to owners and admins. Business teams can correct an agent when it goes wrong, because they can see where it went wrong.
The full feature set is on the Observability page.
The short version
- Every conversation is logged and every run opens into a full trace, with timing, tokens and cost.
- Monitoring is visible only to the organisation’s owners and admins.
- The Dashboard chat is the test bench before an agent meets real users.
- Root-cause analysis for bad answers is on the roadmap.